What the scanner showed
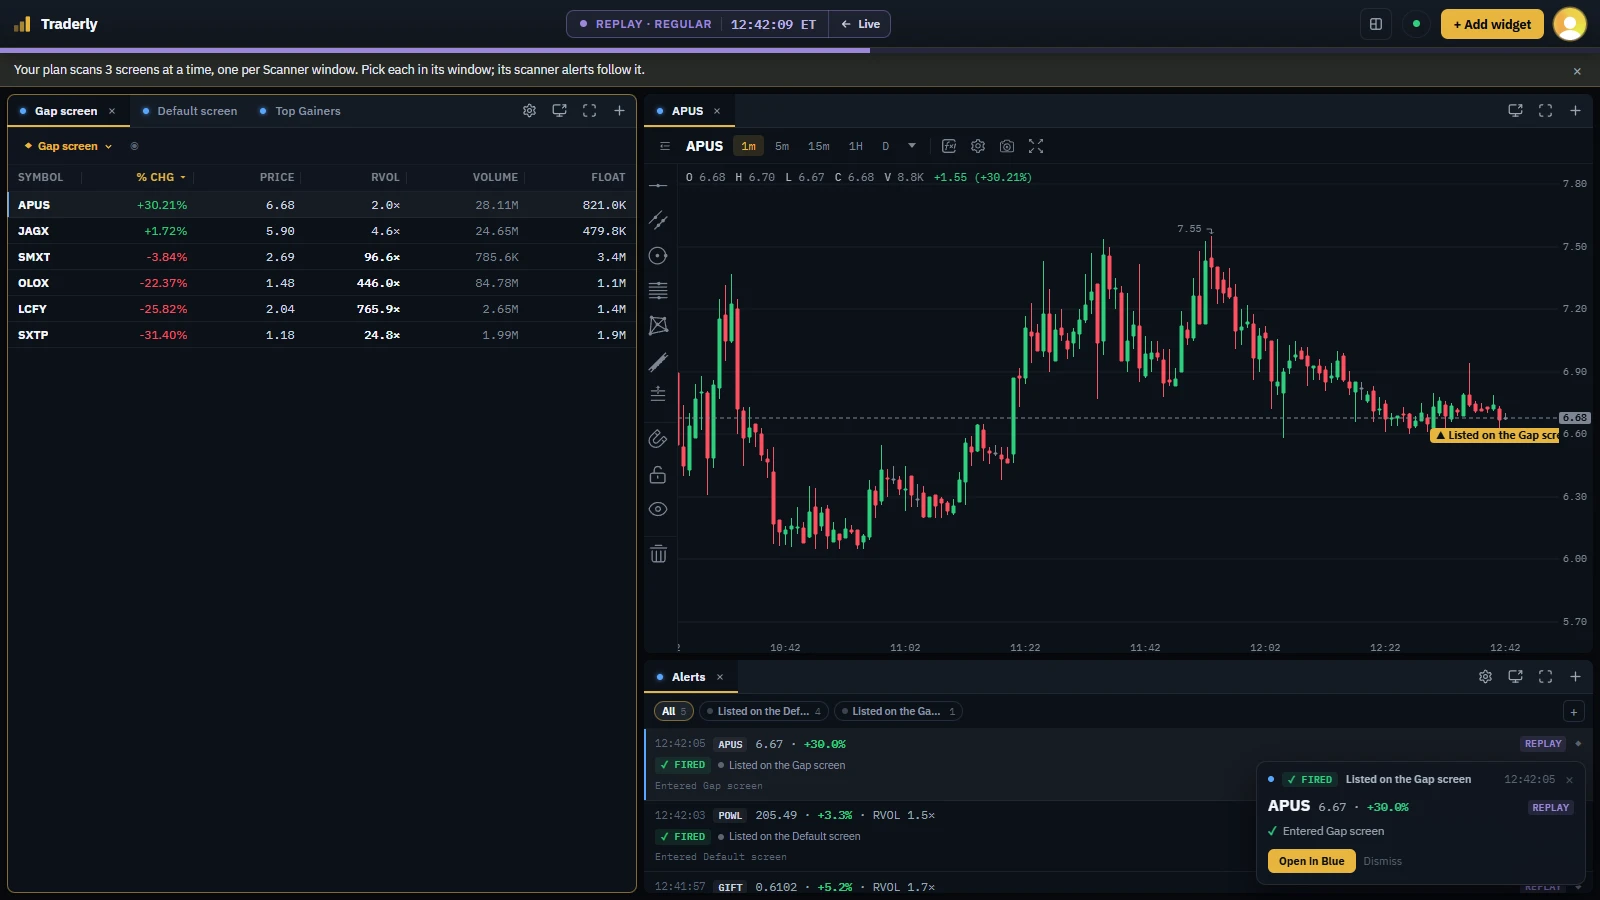
APUS gapped +11.8% from its previous close of $4.59 to its first trade, $5.13 at 04:00 ET. Run over this session's stored bars, Traderly's Gap screen lists it at 12:42:04 ET at $6.67, up 30.0% from its open with RVOL 2.0× on 28.1M shares. It is the first of 6 stocks the screen lists at that minute.
The Gap screen came into use on October 7, the day after this session. Traderly's market data is delayed 15 minutes, so a live user running the screen would have seen that listing from about 12:57 ET, still showing the 12:42 ET price. Replay shows it at 12:42 ET itself.
What it did next
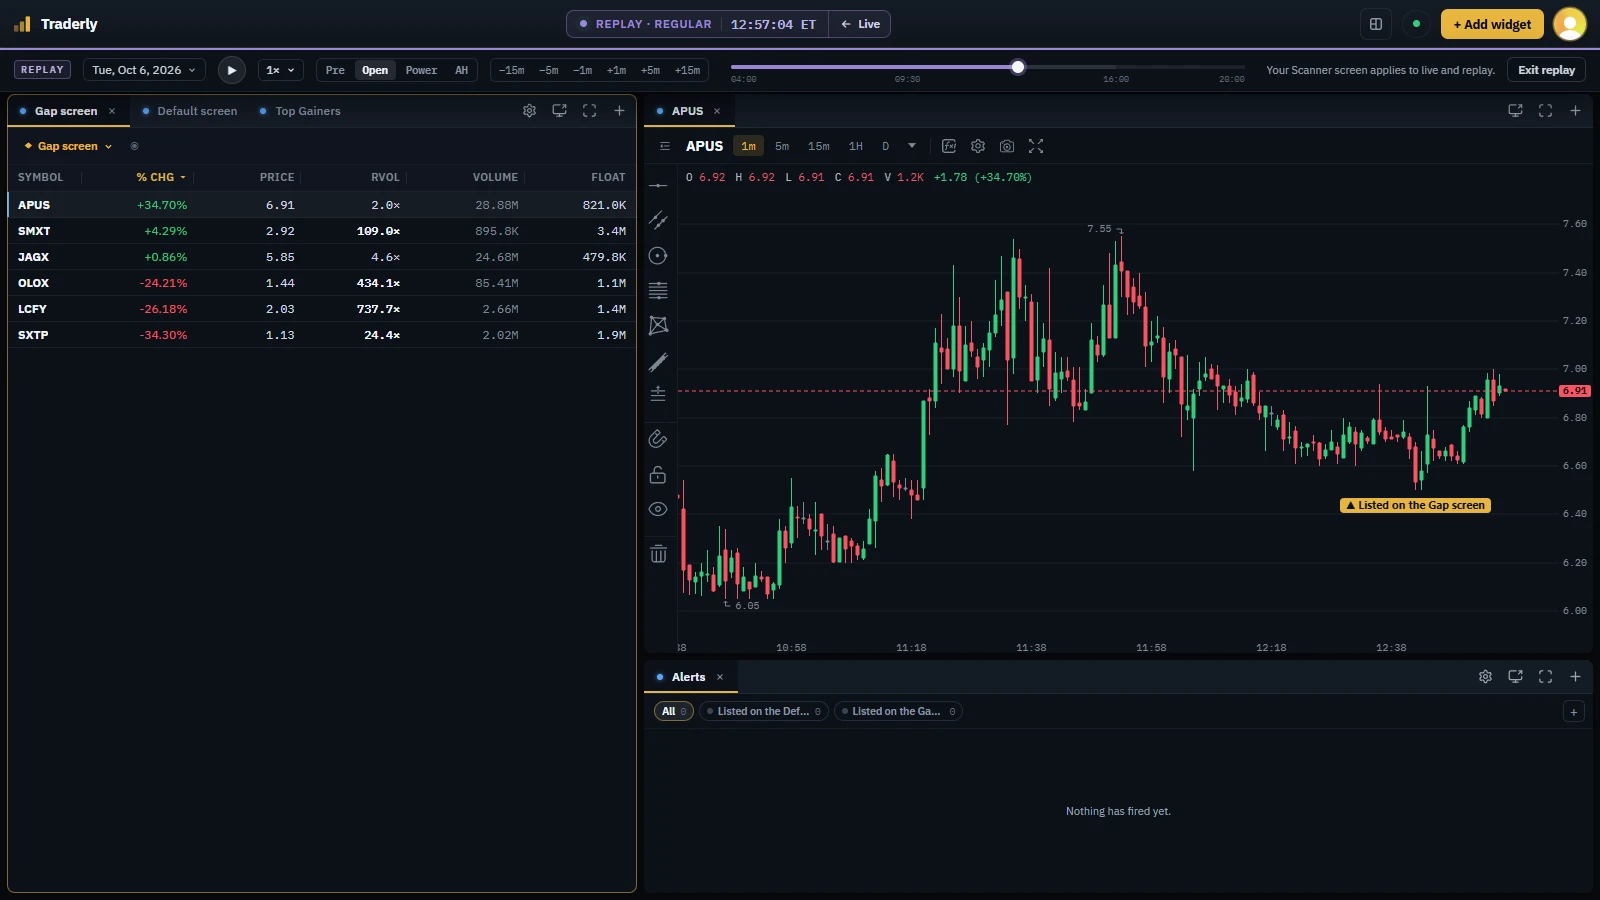
Its low after the listing came within the same minute: $6.50 at 12:42:46 ET, −2.6% from its listing. It peaked at $8.39 at 13:50:10 ET, +63.6% from its open and +25.8% from its listing, a little over an hour after it appeared.
It closed the regular session at $7.08 at 16:00 ET, +38.0% from its open and +6.1% from its listing: below its high, above its listing. After hours it eased to $6.99 at 20:00 ET, +36.3% from its open.
How to read a gap like this
The gap was there from the first trade, and its price was inside the screen's price band. The filter APUS waited on was relative volume. At 07:06 ET, when Top Gainers would have listed it, its RVOL was 0.3× on 166K shares; by 11:22 ET it was 1.5×. The Gap screen asks for RVOL above 2×, and APUS reached 2.0× only at 12:42 ET, when its price was already +30.0% from its open.
So this listing is a midday one, not a premarket one: the screen showed the stock once its volume caught up with its gap, and the run to its high came after that. The premarket gap scanner settings guide covers each of the Gap screen's filters, and the relative volume guide explains what RVOL measures and why it can trail a gap.