What the scanner showed
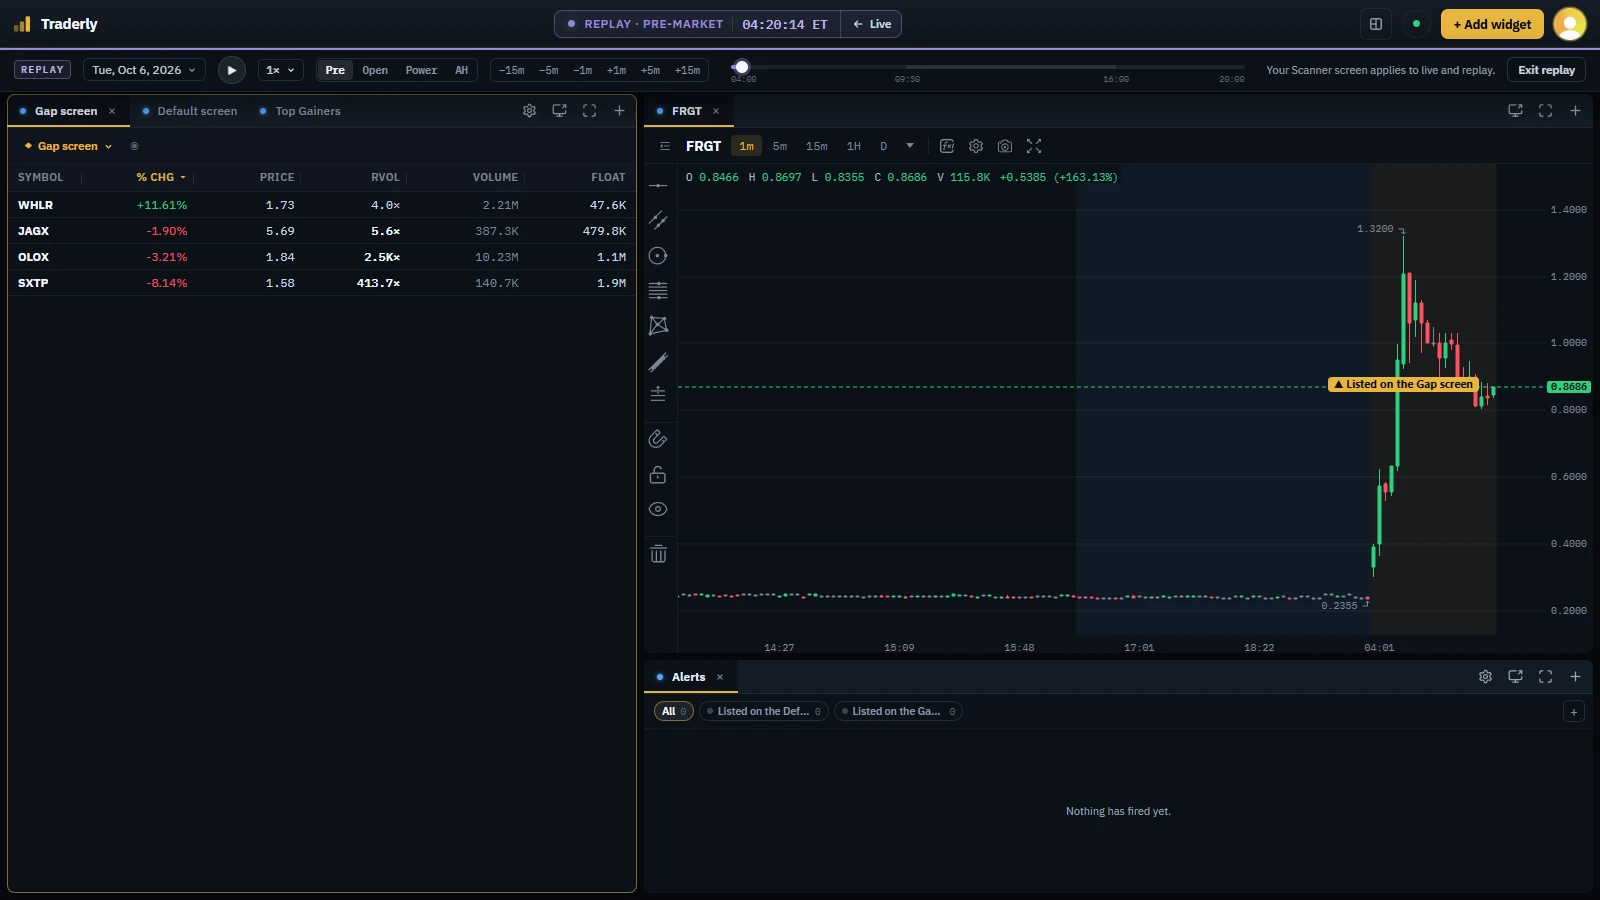
FRGT gapped +34.7% from its previous close of $0.2450 to its first trade, $0.3301 at 04:00 ET. Run over this session's stored bars, Traderly's Gap screen lists it at 04:05:14 ET at $1.00, up 202.9% from its open with RVOL 1853.7× on 9.6M shares. It is the first of 4 stocks the screen lists at that minute.
The Gap screen came into use on October 7, the day after this session. Traderly's market data is delayed 15 minutes, so a live user running the screen would have seen that listing from about 04:20 ET, still showing the 04:05 ET price. Replay shows it at 04:05 ET itself.
What it did next
The listing came seconds before the top. FRGT peaked at $1.32 at 04:05:38 ET, +299.9% from its open and +32.0% from its listing, and never traded that high again. By 04:20 ET, when the delayed view would have shown the listing, the high was already behind it. Replay at that minute shows it back under a dollar and out of the screen's table.
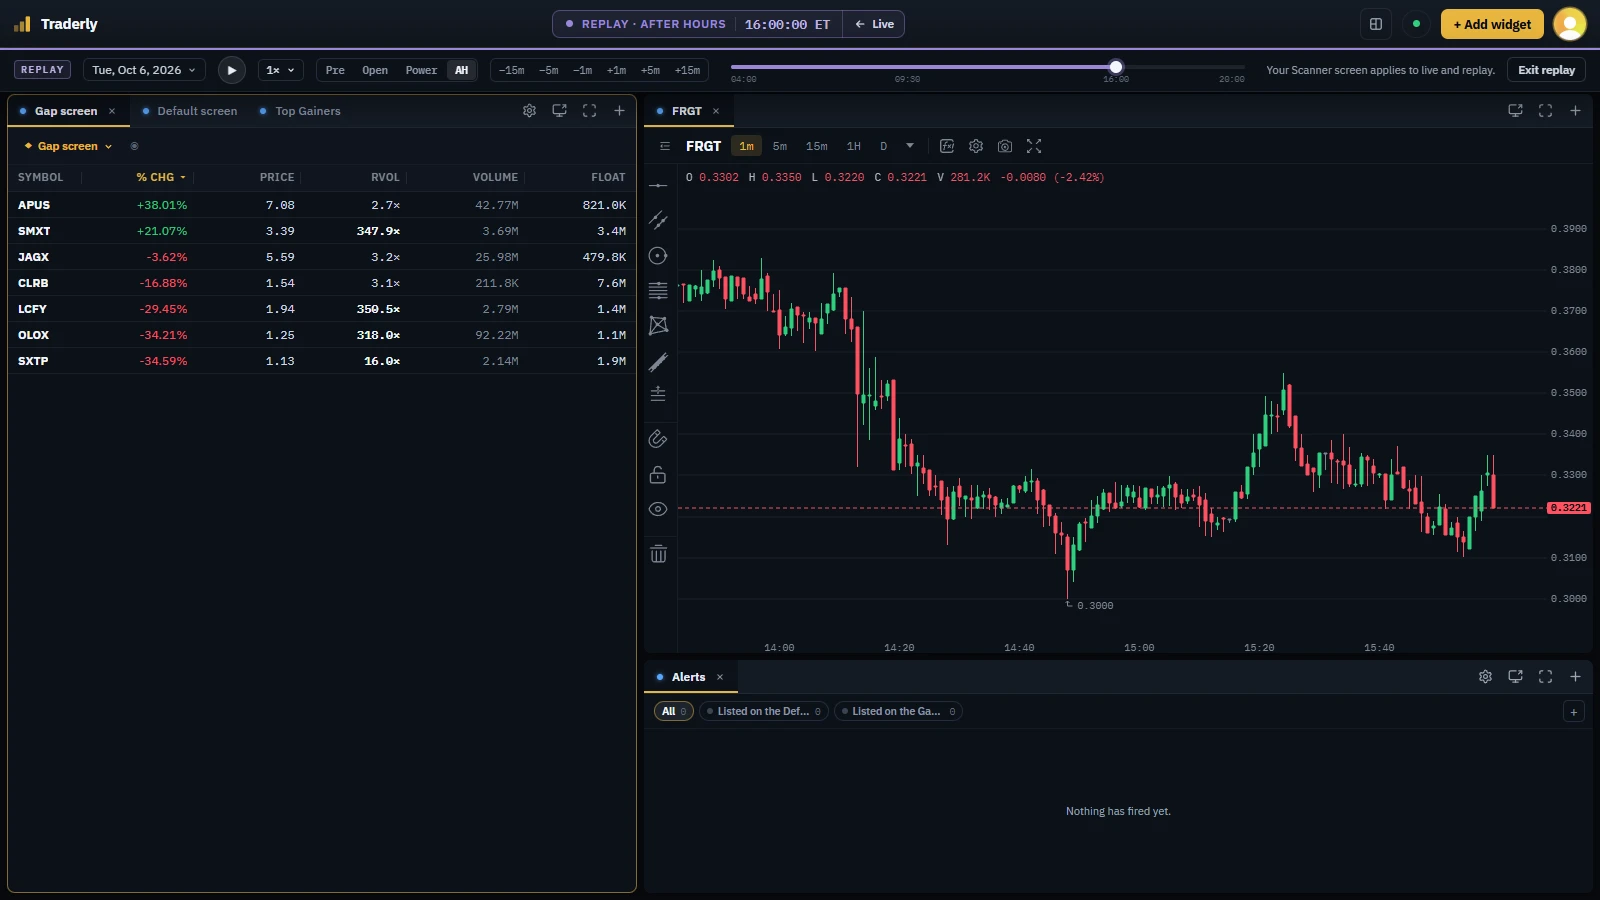
From there it gave the move back. It closed the regular session at $0.3221 at 16:00 ET, −2.4% from its open and −67.8% from its listing, below where it had first traded at 04:00 ET. After hours it kept sliding: its low after the listing was $0.2701 at 19:59 ET, −73.0% from its listing, and it ended the session at $0.2798 at 20:00 ET, −15.2% from its open.
Why a miss is worth a post
This one shows two things a gap list does not tell you. FRGT opened at $0.3301, under the Gap screen's price band, which starts at a dollar; it appeared only when it reached $1.00, after most of its move from the open was done. And an RVOL of 1853.7× says how heavily it traded against its usual volume, not where the price goes next.
The premarket gap scanner settings guide covers the filters that listed it, and the relative volume guide explains what an RVOL that high measures.