TraderlyENES

AIOK, on the Gap screen at 09:58 ET, peaked +163% from its listing

What the scanner showed

Ran
ScreenGap screen (Gapped up % above 10 · Price between 1 and 20 · Traded today above 100,000 · Relative volume (RVOL) above 2 · Float below 20M)
First listed09:58:01 ET, 1st of 5 the screen listed at that minute
At that moment$5.92 · +26.5% from its 08:55 ET open · gap +10.1% · RVOL 12.5× · 102K shares
On delayed dataa live Traderly user saw it from about 10:13 ET, showing the 09:58 ET price
Session high$15.59 at 12:06:40 ET, +233.1% from its open
Close (16:00 ET)$12.06, +157.7% from its open
From the listinghigh +163.3%; close +103.7%; low after the listing −7.1% (09:58 ET)
The recap account's alerts“Listed on the Default screen” fired at 09:56 ET (live, delayed feed)“Listed on the Gap screen” fired at 09:58 ET (live, delayed feed)
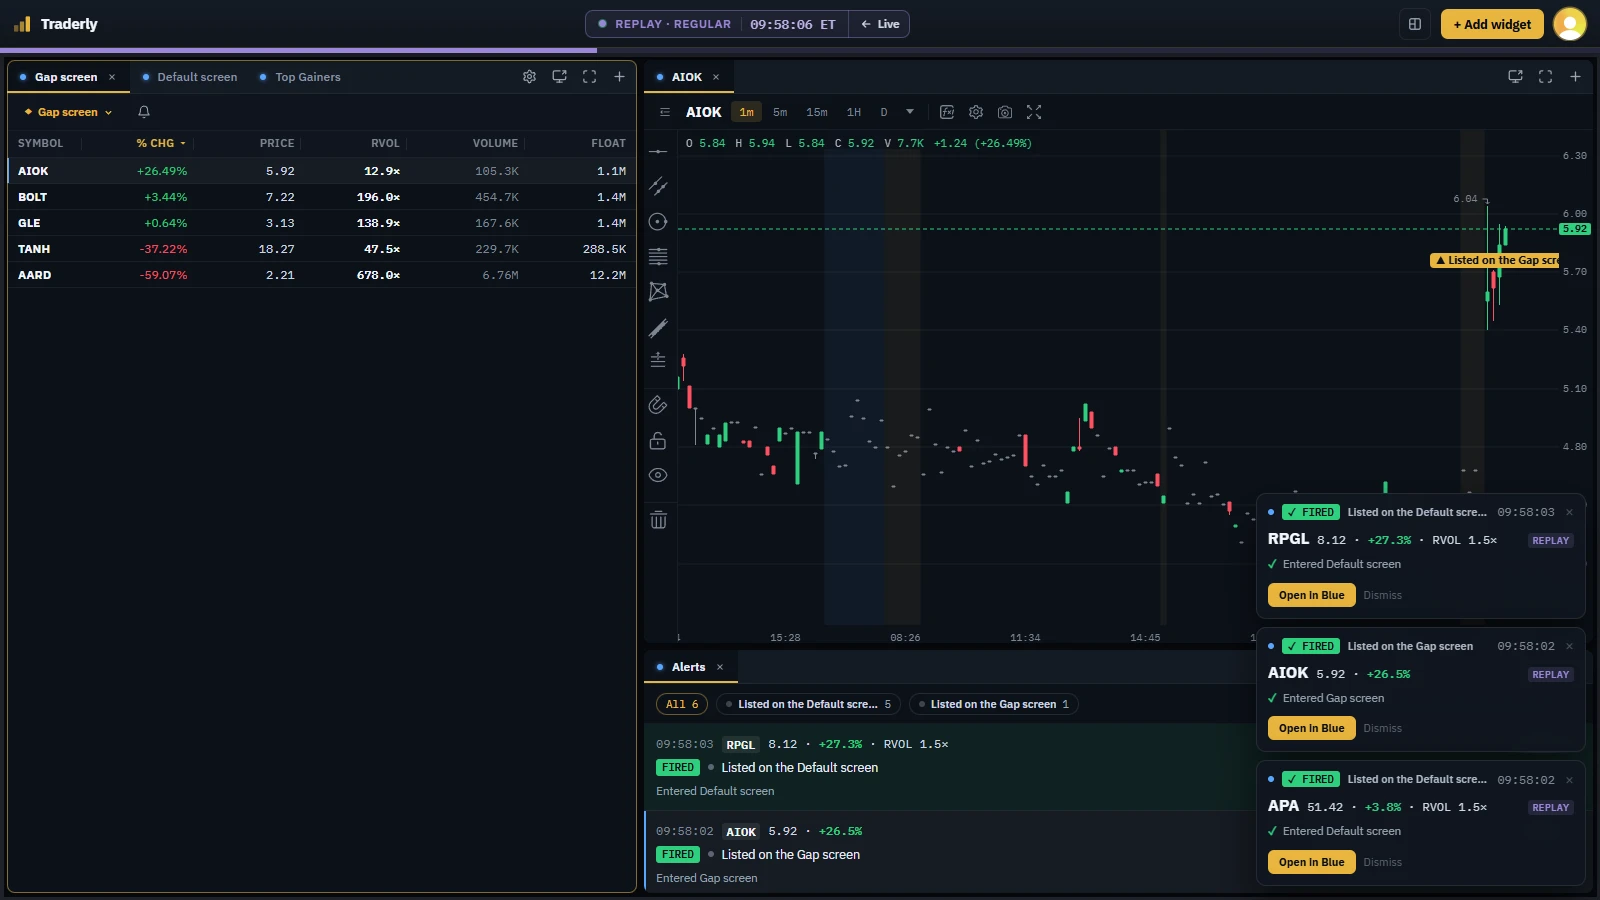
Traderly's Gap screen in replay at 09:58 ET on October 23, 2026, with AIOK listed first of 5 at $5.92, up 26.5% from its open, and its Gap screen alert at 09:58:02 ET
The Gap screen in replay, at 09:58 ET, seconds after it listed AIOK.

What the scanner showed

AIOK gapped +10.1% from its previous close of $4.25 to its first trade, $4.68 at 08:55:58 ET. Traderly's Gap screen listed it at 09:58:01 ET at $5.92, up 26.5% from its open with RVOL 12.5× on 102K shares. It was the first of 5 stocks the screen listed at that minute.

Traderly's market data is delayed 15 minutes, so a live user saw that listing from about 10:13 ET, still showing the 09:58 ET price. Replay shows it at 09:58:01 ET itself.
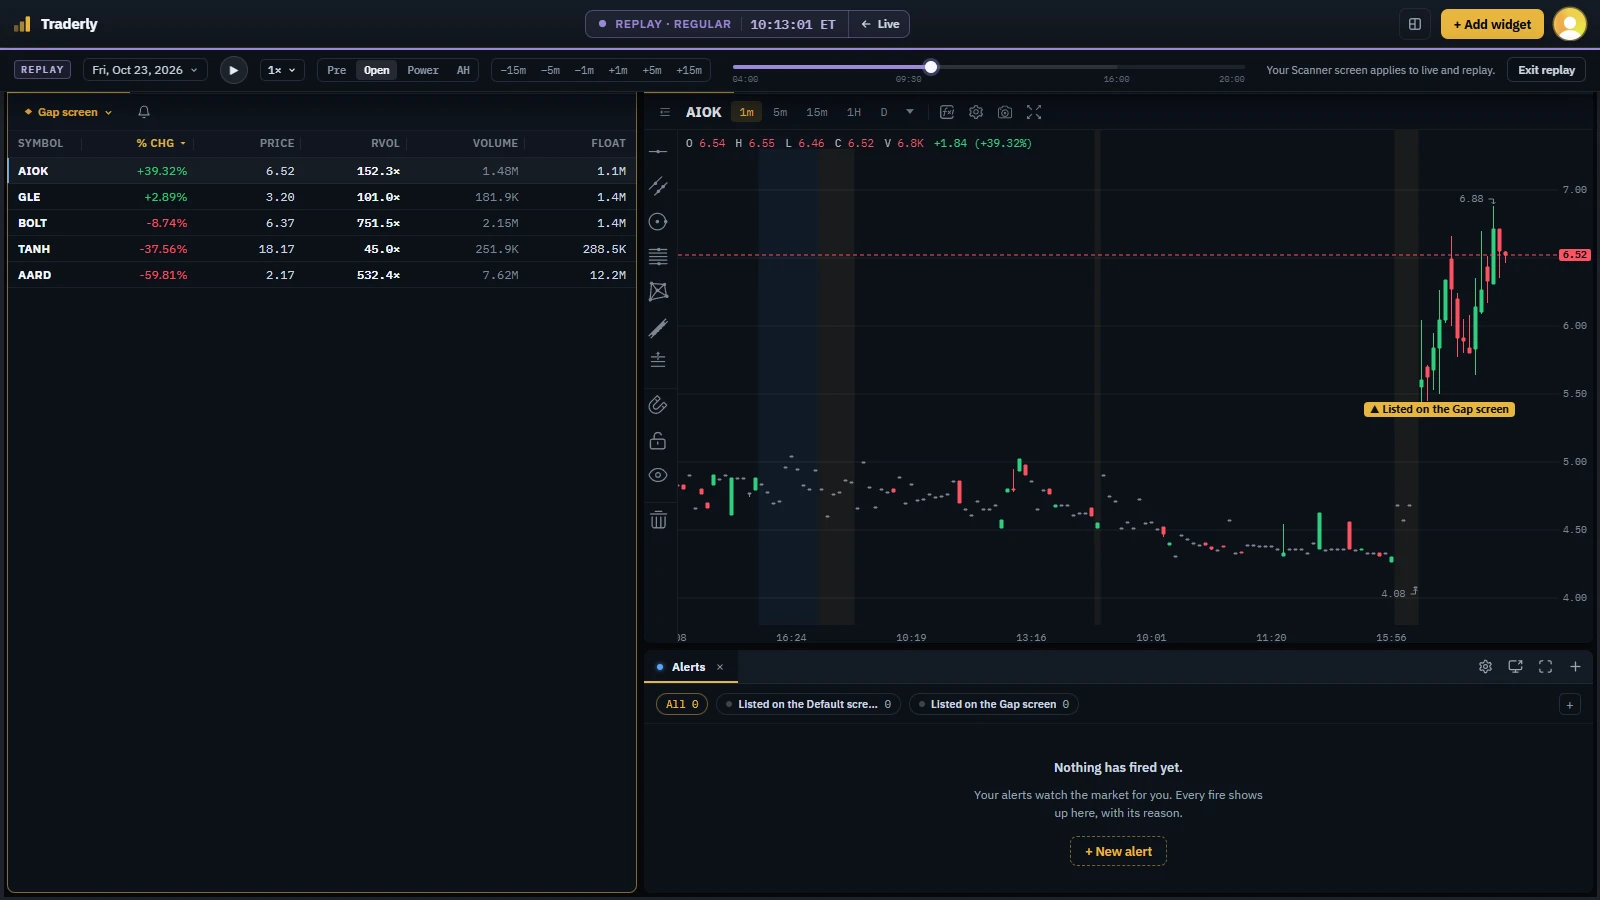
Traderly's Gap screen in replay at 10:13 ET, when the delayed view first showed the 09:58 ET listing, with AIOK still first and back above its listing price
Replay at 10:13 ET, when the delayed view showed the listing: by then AIOK was back above its listing price.

What it did next

Its low after the listing came within the same minute: $5.50 at 09:58:31 ET, −7.1% from its listing. Holding from the listing meant sitting through that dip first; it never traded lower for the rest of the session. By 10:13 ET, when the delayed view showed the listing, it was back above its listing price.

Then it ran. AIOK peaked at $15.59 at 12:06:40 ET, +233.1% from its open and +163.3% from its listing. It closed the regular session at $12.06 at 16:00 ET, +157.7% from its open and +103.7% from its listing: well below its high, still far above its listing. After hours it slid to $9.82 at 20:00 ET, +109.8% from its open.
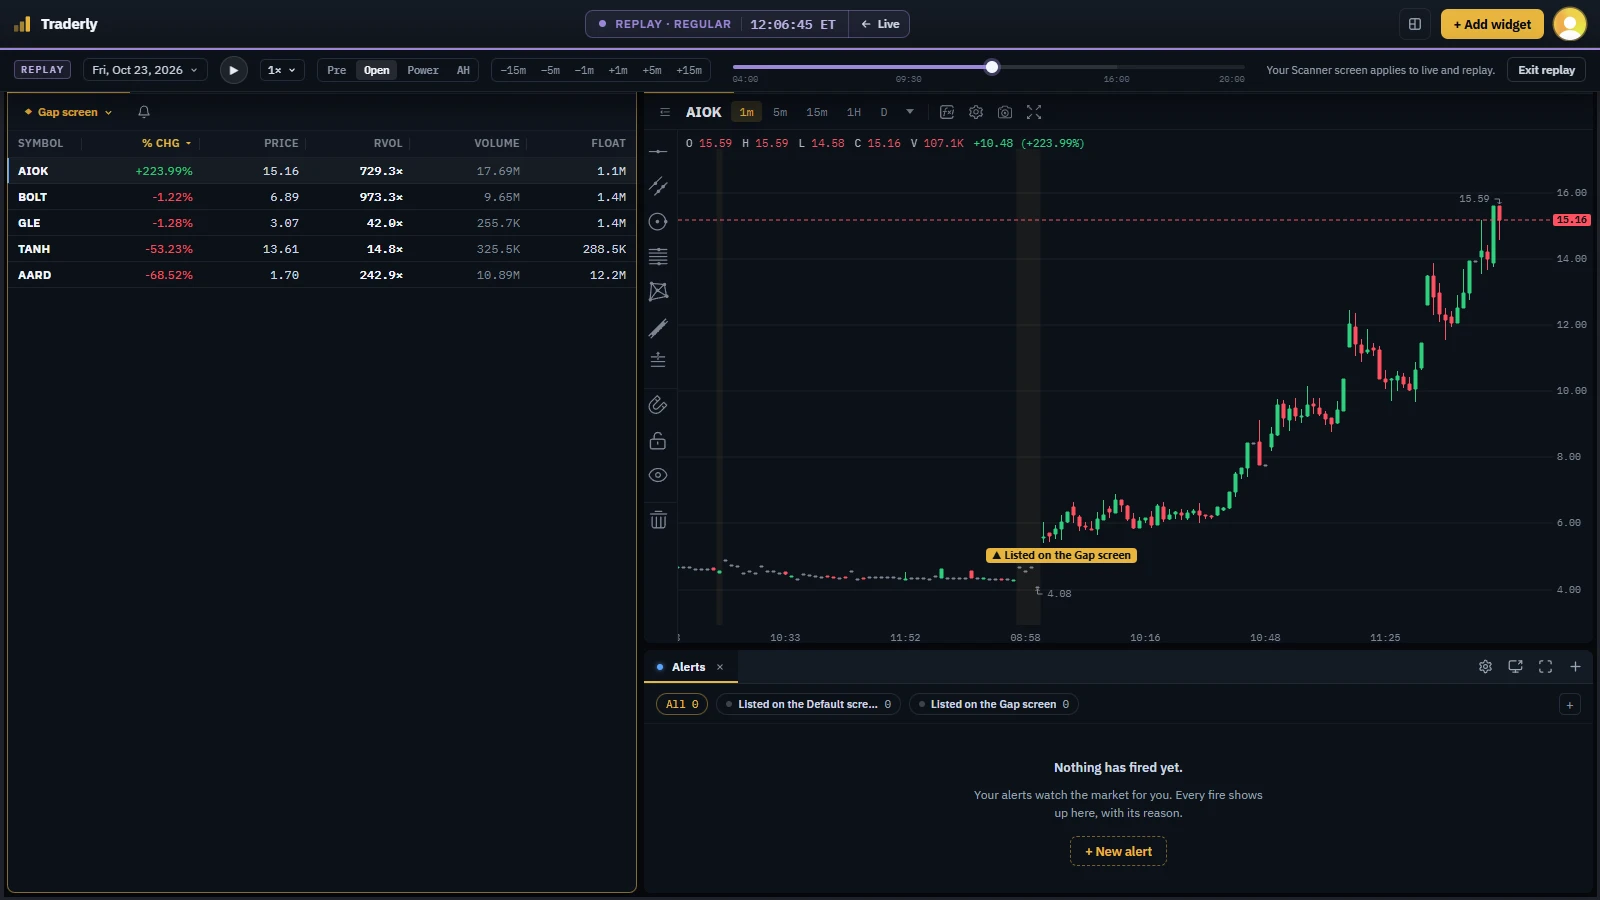
Traderly's workspace in replay at 12:06 ET on October 23, 2026, seconds after AIOK made its session high, with its chart marking the $15.59 high
The workspace in replay at 12:06 ET, seconds after the session's high.

How to read a gap like this

The gap was there from the first trade, if only just: the Gap screen asks for a gap above 10%, and AIOK's was +10.1%. What it waited on was volume. It traded only a handful of small lots in the premarket, so its listing came after the 09:30 ET open, once the volume arrived all at once in the minutes around 09:56 ET. At 09:56:57 ET, when the Default screen listed it at $5.60, it had traded 50K shares with RVOL 6.3×: enough for that screen, short of the Gap screen's volume filter. The Gap screen showed it at 09:58:01 ET, once it had traded 102K shares.

An RVOL of 12.5× says how heavily a stock trades against its usual volume, not where its price goes next: AIOK's low after the listing came first, and its high about two hours later. The premarket gap scanner settings guide covers each of the Gap screen's filters, and the relative volume guide explains what RVOL measures.

How this one was picked

Of the stocks that ended the session up 30% or more from their open, the one the Gap screen listed earliest.

One of 4 the Gap screen listed before 09:30 ET.

The screen: Gap screen

  • Gapped up % above 10
  • Price between 1 and 20
  • Traded today above 100,000
  • Relative volume (RVOL) above 2
  • Float below 20M

In use since

Replay this session

Traderly's replay puts the scanner and the charts back on any of the last 5 sessions, second by second, at up to 5×.

New to practicing on past sessions? Start with How to Practice Day Trading Without Risking Money.

Traderly is in early access, by invitation. Market data is delayed 15 minutes.

Join the waitlist

Reconstructed from Traderly's stored one-second bars with the scanner's own formulas; the live, delayed feed may have differed by seconds. Float is the latest on record. Screens taken in Traderly's replay of the session; an alert's mark in replay is the replay's own fire.